Unlocking the secrets to online business growth starts with harnessing the power of analytics. In today’s competitive digital landscape, understanding your website traffic, customer behavior, and marketing campaign performance is no longer optional—it’s essential. This article will explore how leveraging data analytics can provide actionable insights to optimize your online strategies, leading to increased revenue, enhanced customer engagement, and ultimately, a more successful online business.
Why Data Matters for Business Growth

In today’s competitive online landscape, data is no longer a luxury; it’s a necessity for sustained business growth. Understanding your data allows for informed decision-making, moving beyond guesswork and intuition.
Data-driven insights reveal crucial information about your target audience, including their preferences, behaviors, and purchasing patterns. This allows for the creation of more effective marketing campaigns, leading to increased customer acquisition and retention.
Furthermore, analyzing website traffic and sales data helps identify areas for improvement. By pinpointing bottlenecks in the customer journey or underperforming products, businesses can optimize their processes and allocate resources more effectively, ultimately boosting revenue and profitability.
Ignoring data leads to missed opportunities and inefficient resource allocation. Leveraging analytical tools and employing a data-driven strategy is paramount for achieving sustainable growth in the online business world.
Setting Up Google Analytics and Google Tag Manager
Google Analytics (GA) is a free service that provides valuable insights into website traffic and user behavior. Setting it up involves creating a GA account, obtaining a tracking ID, and adding the tracking code to your website. This allows you to monitor key metrics such as page views, bounce rate, and user demographics, providing crucial data for business growth.
Google Tag Manager (GTM) simplifies the process of adding and managing various tracking tags on your website, including those for GA. Instead of directly modifying your website’s code, GTM acts as an intermediary, allowing you to implement and update tags through a user-friendly interface. This reduces the need for technical expertise and minimizes the risk of errors when deploying tracking codes. Setting up GTM involves creating an account, adding a container to your website, and configuring tags, triggers, and variables to track specific events and actions.
Integrating GA and GTM provides a powerful analytics solution. With GTM managing your GA tag, you gain increased efficiency and flexibility in tracking website activity. Proper setup of both platforms is essential to accurately measure your website’s performance and gather actionable data to support your online business growth strategies. Consider consulting resources or professionals if you need assistance during setup.
Understanding Audience Behavior Through Metrics
Understanding your audience’s behavior is crucial for online business growth. Analytics provide the data needed to achieve this understanding. By tracking key metrics, you gain valuable insights into how users interact with your website or app.
Website traffic metrics, such as bounce rate, time on site, and pages per visit, reveal user engagement levels. A high bounce rate might indicate poor website design or irrelevant content, prompting necessary improvements. Conversely, longer time on site and multiple page views suggest engaging content and a positive user experience.
Conversion rates are critical indicators of success. Tracking conversion funnels helps identify bottlenecks in the user journey and areas for optimization. Analyzing acquisition channels—like organic search, social media, or paid advertising—helps determine which strategies are most effective at driving conversions.
Demographic and behavioral data, such as age, location, device used, and purchasing history, further refine your understanding of your audience. This granular level of insight allows for personalized marketing and targeted content strategies, maximizing engagement and conversions.
By consistently monitoring and analyzing these key metrics, businesses can make data-driven decisions to improve their online presence, enhance user experience, and ultimately, achieve sustainable growth.
Tracking Conversions and Customer Journeys

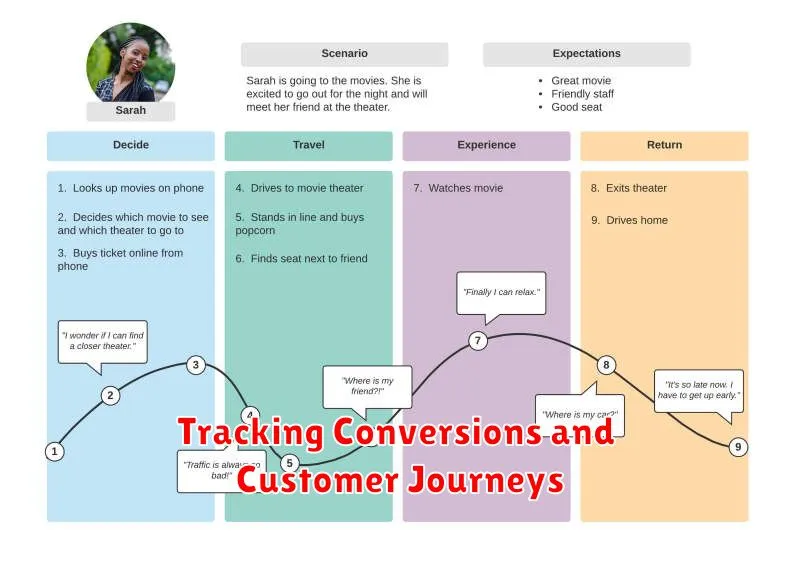
Understanding how customers interact with your online business is crucial for growth. Tracking conversions, such as purchases or newsletter sign-ups, provides quantifiable data on the effectiveness of your marketing efforts. This allows you to identify high-performing channels and optimize campaigns for better results.
Customer journey mapping complements conversion tracking by providing a qualitative understanding of the customer experience. By analyzing the steps customers take before converting, you can identify pain points and areas for improvement. This holistic view allows for more targeted improvements across your website and marketing strategies. For example, understanding where customers abandon their carts can inform improvements to the checkout process.
Integrating conversion tracking and customer journey analysis provides a comprehensive view of your business’s performance. This integrated approach helps you identify not just what is working, but why, leading to data-driven decisions that boost sales and customer satisfaction. Effective analytics empower your business to adapt and thrive in a dynamic online marketplace.
How to Use Heatmaps and Session Recordings
Heatmaps visually represent user engagement on your website. They show where users click, scroll, and hover, highlighting areas of high and low interest. This allows you to identify what content resonates and what needs improvement. By analyzing heatmaps, you can optimize your website layout, improve call-to-action placement, and enhance the overall user experience.
Session recordings offer a deeper understanding of user behavior. They provide a video replay of individual user sessions, showing how visitors navigate your website. This allows you to witness the user journey firsthand, identifying pain points and areas for improvement. Session recordings are particularly useful for troubleshooting navigation issues, understanding user workflows, and uncovering unexpected user behaviors.
Together, heatmaps and session recordings provide a powerful combination for website optimization. Heatmaps provide a high-level overview of user engagement, while session recordings offer granular detail on individual user experiences. By using these tools strategically, you can gain valuable insights into user behavior, identify areas for improvement, and ultimately drive growth for your online business. Analyzing this data allows for informed decisions regarding website design, content strategy, and marketing efforts.
Identifying Bottlenecks and Optimizing Pages
Understanding your website’s performance is crucial for growth. Analytics tools provide invaluable data to identify bottlenecks hindering user experience and conversions.
Key metrics to analyze include bounce rate, time on page, exit pages, and conversion rates. High bounce rates on specific pages indicate potential problems with content, design, or loading speed. Low time on page might suggest unengaging content or poor navigation. Analyzing exit pages reveals where users leave your site, highlighting areas needing improvement.
Once bottlenecks are identified, optimization strategies can be implemented. This could involve improving page speed through image optimization and code minification, enhancing content quality to better engage users, simplifying navigation, or improving call-to-actions. A/B testing different versions of pages allows for data-driven optimization.
Regularly monitoring these metrics and iteratively optimizing your pages based on data insights ensures a consistently improving user experience, ultimately driving increased engagement and conversions.
Creating Dashboards for Clear Business Insights
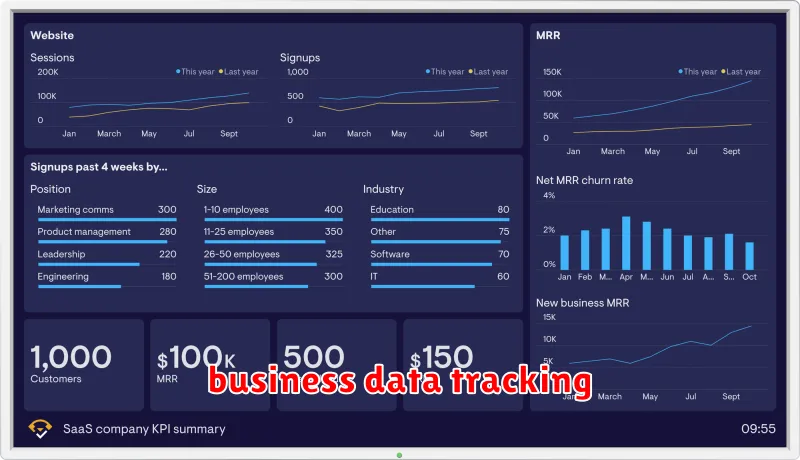
Effective data visualization is crucial for understanding your online business’s performance. Dashboards provide a centralized view of key metrics, enabling quick identification of trends and areas needing attention.
A well-designed dashboard should highlight key performance indicators (KPIs) relevant to your business goals. This might include website traffic, conversion rates, customer acquisition cost (CAC), customer lifetime value (CLTV), and revenue. The specific KPIs will vary depending on your business model and objectives.
Choosing the right dashboarding tool is important. Consider factors such as ease of use, integration with existing analytics platforms (like Google Analytics), customization options, and reporting capabilities. Many tools offer pre-built templates to simplify the process.
Regularly reviewing your dashboard allows for proactive decision-making. By monitoring KPIs, you can identify emerging problems, measure the effectiveness of marketing campaigns, and optimize your business strategies for improved growth.
Ultimately, creating a clear and concise dashboard helps translate raw data into actionable business insights, leading to more informed decisions and a stronger online presence.
Using Analytics to Plan Future Strategies
Analyzing website data is crucial for effective future planning. Key performance indicators (KPIs) such as website traffic, conversion rates, and customer acquisition cost provide insights into what’s working and what’s not.
By understanding customer behavior through analytics, businesses can identify trends and predict future needs. This allows for proactive adjustments to marketing strategies, product development, and overall business operations. For example, a significant drop in conversion rates from a specific marketing campaign warrants an immediate review and adjustment of the campaign strategy.
Predictive analytics can forecast future performance based on historical data. This allows businesses to anticipate challenges and capitalize on opportunities, leading to more informed decision-making. Analyzing seasonal trends, for instance, enables businesses to optimize inventory and staffing levels effectively.
Furthermore, A/B testing, facilitated by analytics, allows for data-driven optimization of website design and marketing materials. By testing different versions, businesses can identify the most effective strategies for increasing conversions and improving the overall user experience. This iterative process leads to continuous improvement and enhances long-term growth.
In conclusion, leveraging analytics empowers businesses to move beyond reactive strategies and adopt a proactive approach. By utilizing data-driven insights, organizations can make informed decisions to optimize their operations and achieve sustained online business growth.

